
Lies, Damn Lies and Statistics…
I recently read an interesting article in the Sydney Morning Herald, entitled “Workaholics prefer Potts Point, but it’s go slow at the beach”. The very first paragraph by the author, (@MAttWadeSMH), makes the rather bold statement:
“The densely populated harbourside neighbourhood of Potts Point has emerged as Sydney’s hardest working suburb”.
This assertion was made on the basis of the recently released Australian Bureau of Statistics Census data for 2011.
Now, a very good friend, Richard Hoptroff, once made the comment: “If you torture the data long enough, it will tell you what you want to hear”. So I wonder if, in this particular case, the headline (a good one, admittedly) wrote itself and the Census data was then scoured for supporting evidence? Rather than, say, finding a way of letting the data tell it’s own story, free from what Bazerman would call “judgemental bias” (Bazerman, M.H. and Moore, D.A. (2008), Judgment in Managerial Decision Making, 7th ed. New York: Wiley.)
To support the story, several beach communities were used by way of contrast to “hard working” Potts Point(“..Pearl Beach workers only clocked up 29.4 hours”). So, I thought it would be interesting to put the data (freely available from http://abs.gov.au/census) into a Data Visualization tool (Tableau) and see what emerged..
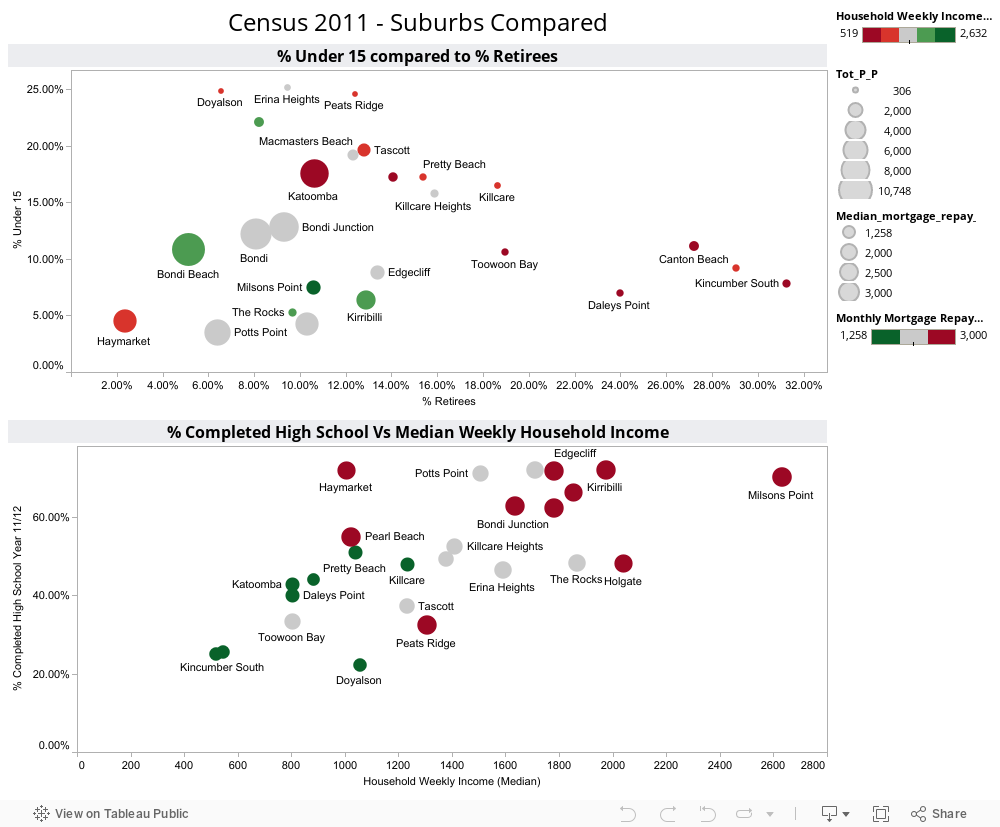
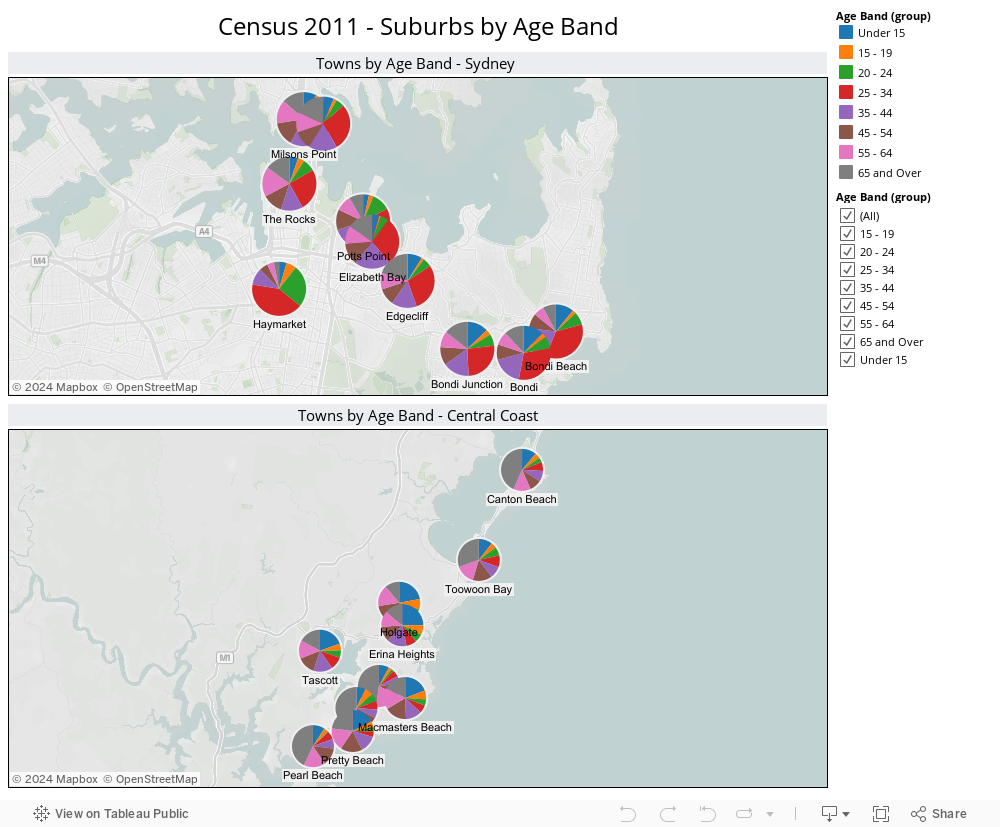
Immediately, it became obvious that large demographic differences were driving differences in median hours worked per week by suburb, not work ethic. For example, the communities called out for “only clocking up” less than 30 work hours per week, are made up of a significant proportion of retirees (Pearl Beach has 29% over 65, Kincumber South 31%, Potts Point only 6%. The median age in Kincumber South is 64, in Pearl Beach it is 62, in Potts Point, 35). So including those no longer working in a calculation of average working hours for a community is clearly flawed analysis (I’m sure those in the retirement communities of Kincumber South would argue they’ve worked hard enough for many years!!)
Similarly, Haymarket, another suburb called out in the “hall of shame” (ie in the Bottom 3 suburbs for average hours worked), has 31% aged between 15-24, with a median age of only 27. Now, with University of Technology Sydney and the University of Sydney within walking distance, I suspect this indicates these are university students (some may take offence to the notion that getting a degree is not “hard work”…).
Close to the “go slow” beach communities of Pearl Beach and Kincumber South, but at the other end of the spectrum in terms of demographic, are the communities of Erina Heights and Doyalson, both with 25% of their communities under 15 (compared to Potts Point which has 3% under 15). On the eve of National Teleworking Week, I wonder if we should instead be applauding those communities for striving for some level of work-life balance? (unless, of couse, @MAttWadeSMH has included children in his calculation of average hours worked..)
So, we can see that a suburb applauded for it’s work ethic, but with the majority of the population of working age, is very different to a suburb with most of the population over 65 or under 15. Visualizing the data helps us to see the real story behind the numbers.
Addendum:
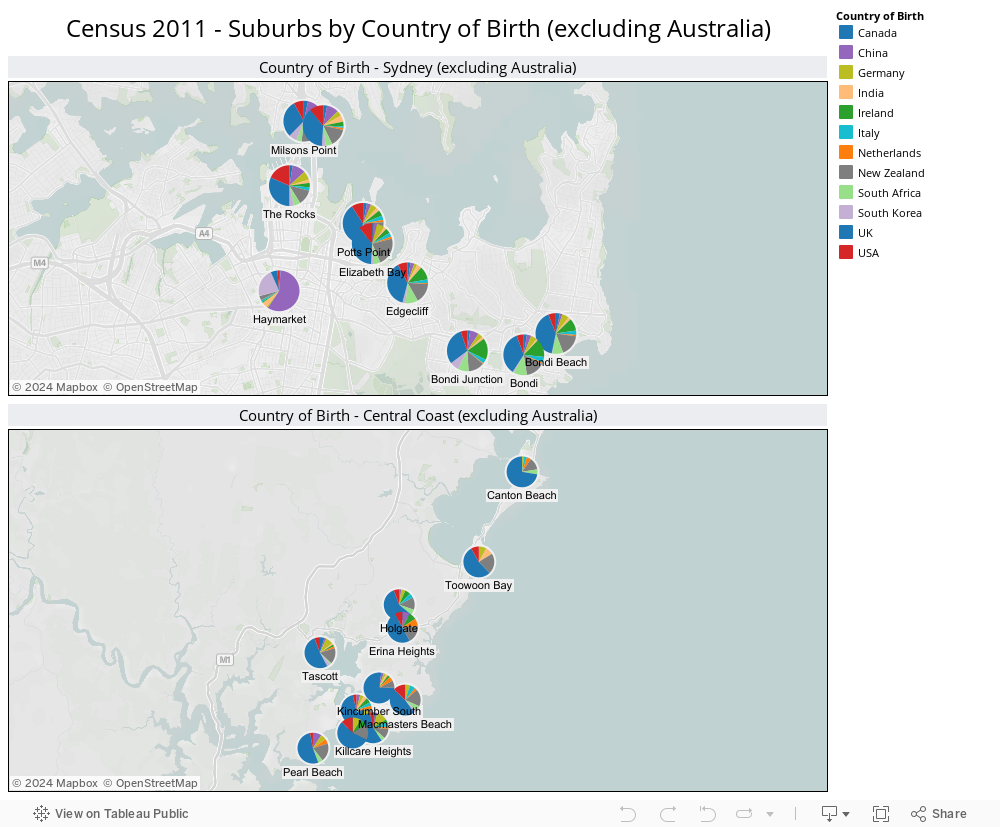
It’s not just the age demographic which is significantly different between the Central Coast and the likes of Potts Point, Milsons Point etc. Ethnicity by suburb also varies drastically, as shown by the following visualization:


Nice Visualisation – Tells a great story !
Great analysis !