Chat with us, powered by LiveChat

Visit our new site! Click seechange.com.au

Category: Business Intelligence

Lessons on data analytics from a tween

Lessons on data analytics from a tween

March 8, 2018 | By | Add a Comment

I recently received a note from my 11 year old son’s maths tutor, which read:

“Jack will be covering Data, specifically: collecting categorical and numerical data thru observations and surveys, Constructing data displays including dot plots, column graphs and line graphs, naming and labelling vertical and horizontal axes, Using scale to determine placement of each point when drawing a line graph.”

“Aha! Welcome to the world of Business Intelligence!” I thought with a smile. Excitedly, I introduced Jack to my veritable library of books on the subject of charting and data visualization, including of course, all my favourites such as “Signal: Understanding What Matters in a World of Noise” by Stephen Few, “The Wall Street Guide to Information Graphics (the do’s and don’ts of presenting data, facts and figures)”, “Data Points: Visualization That Means Something” and many others. With no words and a tweenage look of disdain, he resumed his game of Roblox (Minecraft was no longer “cool” since it’s acquisition by Microsoft, I was off-handedly informed…)

Then, almost in passing, Jack mused: “I wonder how the number of Roblox users by year would look in a line chart…?”

Challenge accepted. A quick Google search, drop the data into a self-service data visualization tool, and we had our answer.

What was quite interesting to me was that he was thinking in terms of the data, wanting to answer a question empirically, and wanting to see the data visually to interpret the results. Now, as I listen to my son in the background, collaborating in real-time with one of his school friends in multi-player Roblox while they chat and interact simultaneously through Facetime, it’s occurs to me that future generations of ‘knowledge worker’ are likely to be much more collaborative and team-oriented, much more visual and data savvy, much less inclined to accept decision-making which cannot be supported by data. Which, of course, reminds me of a classic Dilbert moment:

Source: DilbertDilbert ©2018, Universal Uclick

Couple the inquisitive, knowledge-hungry mindset of our younger generations with the relentless pace of change and innovation, and we can anticipate that our future business users will not be tolerant of poor decision-making or slow time to action caused by the outdated insights provided by traditional analytics infrastructures. Today more than ever, analytics is a key to business success, but it needs simplicity, real-time speed and security: how fast can a user access and blend all the disparate data they need, analyze and share it, then take action, all in a secure and controlled environment? How can we provide solutions which enrich data with context, to build consensus? How can we empowering teams with the right data, providing machine learning-driven insights and personalization? Cognitive, collaborative analytics helps teams take action in real-time, to work on the right things at the right time. Our future decision-makers will expect nothing less.

Footnote – 10 of my favourite books on Data Visualization and Presentation:

Putting the ‘business’ into ‘social’

Putting the ‘business’ into ‘social’

October 25, 2016 | By | Add a Comment

Traditional BI ‘collaboration’ is one-to-many e.g. publishing infographics to a website or emailing a PDF – it’s like running a webinar where the participants are on mute (‘listen only mode’). The future of collaborative BI must evolve to ‘many-to-many’ – including abilities for co-authoring of BI content, as well as co-consumption, annotation, discussion, sharing, editing. The basis of innovation is being able to build upon the work of others, contributing to the ‘body of knowledge’. Collaborating, in other words.

Yet historically, too many people, particularly those involved in Governance of BI systems, have essentiallysilos been ‘anti-collaboration’. Which has, ironically, made the situation worse by encouraging users to find ‘work-arounds’, resulting in, for example, the proliferation of spreadsheets. As Boris Evelson of Forrester Research recently commented to me in an email on this topic, “We increasingly hear from our clients that BI silos are now proliferating.  Basically these  platforms are now becoming the new spreadsheets”

The combination of Enterprise Social platforms such as IBM Connections with more modern Cloud-ready, mobile enabled, self-service BI tools helps move better decision making into the line of business, moving towards an ability to see and manage outcomes in real time. Recent research from Aragon Research suggests that, by the end of 2017, 75% of business will be harnessing mobile collaboration, helping to provide real-time analytics for the team, and embrace agility in the workforce. Sometimes business owners become so much focussed on their growth that they fail to notice the significant amount of money being leaked through their outdated methods of recording employees’ work hours, to solve this you to do proper choosing the time clock software for your company.

The key to Collaborative BI is speed. Speed to a decision. Having better, more informed, fact-based conversations with the right people. As the Irish playwright G. Bernard Shaw famously commented:collaboration1

”…if you have an idea and I have an idea and we exchange these ideas, then each of us will have two ideas.”

Or, at the very least, we have one, better, idea.

And, to finish with one final thought I recently received from my favorite BI Analyst, Howard Dresner:

”One piece of advice for Collaborative BI. Stop using email!”

How Social Business Solutions Power Collaborative Analytics

How Social Business Solutions Power Collaborative Analytics

September 20, 2016 | By | Add a Comment

This article was originally published in Information Management (Sept 2016 edition)

jazz-ensembleTo a greater or lesser extent, everyone collaborates. I watch my two-year-old twins collaborate daily. I listen to the “collaborative creativity” within a jazz ensemble. Yet so often in a work context we operate in silos.

For decades, the silo of choice was the spreadsheet. Today, it’s becoming the data discovery “workbook.” Yet it’s no longer enough to just have meaningful analytics: it’s also about speed.

When Steve Jobs talked about his Macintosh development team at Apple, he talked about “…musicians and poets and artists…” He talked about “trying to expose yourselves to the best things that humans have done.” In other words, getting inspired by the ideas of others. Collaborating.

Consider how musicians collaborate: they predict, perceive, and react to what their fellow musicians do in complex ways. Collaboration is about listening to others and connecting to their emotions or intuitions. Collaborative Business Intelligence is about communicating a story with the data. Communicating the meaning behind the numbers. Business are constantly changing you can check here the most recent innovations for business. The numbers are the notes, in time and space. Harmony. Melody. Rhythm.

collaboration2So what is Collaborative Business Intelligence? According to Howard Dresner, it is “a process where two or more people or organizations work together to develop a common understanding, which is shared and used to build consensus in support of organizational decision making.” Collaborative capabilities include sharing, annotating and co-authoring of business content.

Recent research defines several distinct types or styles of collaboration, including:

  • Distributed Collaboration – informal collaborations based on common interests
  • Complimentary Collaboration – based on complimentary expertise, knowledge and/or roles
  • Integrative Collaboration – collaborative development of a new concept or idea, which no individual could have conceived of on their own

The latter is commonly seen in the context of jazz improvisation, and often in the workplace where Agile principles have been adopted. Development of new ideas, through integrative collaboration, is a powerful way for an organization to foster a culture of Innovation.

People are the heart of business

People are the heart of business

It’s the same in a business context. People are at the heart of business. And Collaborative Analytics, or Collaborative Business Intelligence, is about putting the Business into Social.

Annual revenues for vendors in the Collaboration space are predicted to break $4.5 billion by 2016, and the Enterprise Collaboration Market is projected to be worth $70.61 Billion by 2019. That is significant growth.

In fact, recent research shows Social as the fastest growing segment of the Enterprise Collaboration market, with a projected CAGR over 18% – a trend which is projected to continue for several years. This is perhaps unsurprising considering how social and ‘tech savvy’ the workforce is becoming.

Consider how well-versed our teenagers, the next generation of knowledge workers, already are with social concepts, such as Facebook and WhatsApp. In recent product usability testing, we found that a 15-year-old high school student was able to immediately grasp collaborative BI concepts such as sharing and discussing dashboards via integrated chat, with little or no training.

Collaboration drives organisational alignment

Collaboration drives organisational alignment

As Howard Dresner commented, “Insight built collaboratively adds value faster and achieves faster consensus and better buy-in.” This in turn can help drive better organizational alignment to strategy and goals. It comes down to inspiring, motivating and empowering business users with a passion to help the organization drive better business outcomes for customers and shareholders.

Imagine the following scenario: members of a finance department are collaborating on a new budget. Having blended data from both internal systems as well as external data (for example, projected interest rates or customer demographic data), they seek feedback and collaboration from other managers in the business. They push a dashboard to an internal ‘community’ of managers on their Enterprise Social Platform, and engage in a dialog with those business users around market sentiment, budget assumptions and so on.

This information is captured in the Collaborative BI system, to provide an audit trail for subsequent decisions. Thus avoiding the perpetual issues with emailing static documents and spreadsheets with cell-reference and other common errors, making governance almost impossible.

So what does this mean for the future? What I expect to see is a trend towards solutions which help organisations get better at measuring outcomes, improving accountability in support of evidence-based decision-making. In recent years, the Business Intelligence market has strayed towards what Gartner Research sometimes refers to as the “wild, wild west” of siloed, ungoverned business data, causing “multiple version of the truth.”

An era of social business solutions powering a more collaborating analytical process would certainly be music to my ears._zah3686-copy

As long as it’s jazz.

The parallel between software design and music

The parallel between software design and music

January 22, 2016 | By | Add a Comment
  • how the “workflow” of product design should be harmonious and keep a relationship “to the tonic,” i.e. the objective of the tool or task remains clear;
  • how jazz musicians innovated to create new musical approaches, as we innovate to create new software products and new approaches to solving business problems;
  • how we try to minimum “boredom” in user interface design by minimizing needless mouse clicks, as musicians try to keep the audience engaged.

By way of example, I read the following comment in an email about music a while ago: “Turnarounds started when jazz players became bored with chords that lasted for two bars or more.” This made me laugh! As the joke goes, a rock musician plays three chords to 3,000 people; a jazz musician plays 3,000 chords to three people. The email went on to say “These players thought up new ways to take a long tonic chord and play other chords on top of it to take the harmony to a different place.”

giantsteps-small

As described by the ‘Completion Principle’, people almost involuntarily seek to complete that which is not complete.

When something is certain and known then we feel comfortable and in control. When something is not complete, we cannot close that item in our mind as we have to keep thinking about it.” (Changingminds.org)

Music itself is often a play on an audience’s desire for “completion,” hence the concept of “tension and release” introduced by common harmonic structures such as the II-V-I, which “resolves” back to the I chord (or the V-IV-I in blues).autumn-leaves-small

Interestingly, what is considered musically “acceptable” has changed over the years. From at least the early 18th century, one interval was actually referred to as the devil’s chord: “Diabolus in Musica” (the devil in music), what we now call the tritone or flat 5 (diminished 5th). Perhaps equivalently, it wasn’t that long ago that business software programs were often designed for “experts” rather than laymen, with little consideration to usability or intuitiveness. The concept of a “self-service business intelligence” product was almost an oxymoron.

Yet thinking about features and not about flow (workflow) is akin to thinking about scales and modes, and not about the underlying harmony and melody. Having a bunch of loosely coupled UIs or “studios” is a little like having a bunch of musicians playing who are playing for themselves and not each other, who are not in tune with the rest of the band.

It is certainly just as important to understand the form/structure of a tune as it is to understand the overall structure of a software solution. Usability design (UX) without an understanding of form and function (business needs/problems) is perhaps the equivalent of elevator music.

Once the form (concept, requirements) is/are well understood, however, then good developers can be trusted to improvise and innovate. Similarly with good musicians. Here is a tip I got from a great jazz guitar teacher, Jody Fisher (in relation to creating improvised lines between chords):

chinese_symbols_for_innovation_9599_2_40“You know, you can play almost ANYTHING to approach the next chord; you’d be surprised how freeing this can be…It works because any note has some relationship with any chord–of course it’s a matter of taste…”

In our world, I think this has parallels with giving developers “freedom to create” (or “fail-fast”). “Fast failure” is the new culture driving innovation: being afraid to fail kills ideas. Interestingly, innovation means create-new (Chueng Xin) in Chinese.

What is more important, essence or perfection? Comparing waterfall vs agile development could be analogous to comparing classical vs jazz. Classical has detailed “requirements,” painstakingly developed via the score, which is played as written. Jazz is more free-form, a general idea/form (theme) which is then built upon through improvisation (iterations/sprints).

My friend Adam Rafferty, who studied with Mike Longo (former pianist and musical director for Dizzy Gillespie) ,recently wrote about how Mike described the difference between “How To Play” and “What To Play.”

“How To Play” “What to Play”
  1. Touch
  2. Time
  3. Tone
  4. Technique
  5. Taste
  1. Harmony
  2. Melody
  3. Rhythm
  4. Counterpoint
  5. Form

Adam suggests:

  • “What to play” can generally be written on paper in a book form – it’s “information” much like a cookbook.
  • “How to play” is a bit more elusive…some chalk it up to “feeling” but it’s much more than emotion. It’s intuition and experience.

Similarly in software development. Concepts (harmony), such as “material design,” or architecture (form) such as the “MEAN stack” are the building blocks, but it takes intuition and experience to turn these into elegant software. In fact, it’s sometimes “how to play” can equate to “what not to play.” As Miles Davis once said “it’s not the notes you play; it’s the notes you don’t play.” In his book “Simplicity.” John Maeda comments:

“The simplest way to achieve simplicity is through thoughtful reduction” (John Maeda, ”The Laws of Simplicity”)Simplicity

In my R&D lab we often talk about “simplifying complexity.” It’s much harder to make the complex seem simple than it is to make the simple overly complex. Hence the brilliance of someone like my favorite guitarist, Wes Montgomery.

The great Zen teacher Shunryu Suzuki wrote: “In the beginner’s mind there are many possibilities, but in the expert’s there are few.” Regardless of how much we learn or how expert we become, we can benefit from seeing ourselves as beginners. Keep an open mind. Think “outside of the box.”

To finish with an (alleged) quote from the infamous Yogi Berra:

“Anyone who understands jazz knows that you can’t understand it. It’s too complicated. That’s what’s so simple about it.”

And so it may be with good software design…

Summertime-small2

A/NZ BI Trends – Visualisation, Mobility and Self-Service

A/NZ BI Trends – Visualisation, Mobility and Self-Service

April 1, 2013 | By | Add a Comment

As part of several breakfast briefings I ran in 2011-12 on the topic of Visualisation, Mobility (Mobile BI) and Self-Service Reporting, I asked all participants a number of questions relating to their own internal BI/Reporting environments. This ran in conjunction with an email based survey, which received a very good (7%) response rate. Covering all industries and geographies across A/NZ, I received 230 responses in total. What became clear from the results was that BI, although assumed to be mature and pervasive, had not solved the Reporting problem in most organisations.

Here is a summary of the survey results, in Slide format.

We certainly need to heed the message of frustrated users, and focus on empowering the Knowledge Workers to solve complex business problems. Intuitively. And fast.

For anyone interested in my full survey results report, I can be contacted via email.

Reporting on ‘% of base’ in Cognos10

Reporting on ‘% of base’ in Cognos10

February 11, 2013 | By | Add a Comment

A workaround for the lack of ‘% of base’ functionality in Business Insight Advanced

A common requirement is to be able to product % of total or ‘% of portfolio’ reports, for comparative analysis. Unfortunately, this capability is currently missing in Business Insight Advanced. A workaround exists, which is to use the ‘% of’ calculation provided in Business Insight Advanced to hard-code the total value. However this introduces excessive report maintenance implications.

An alternative approach is to use Analysis Studio, which does support % of base, to ‘author’ the basic report layout required, then finish the report in Business Insight Advanced. (Note, however, that it is currently not possible to open an Analysis Studio view in Business Insight Advanced – it is necessary to open the view in Report Studio first, save to Cognos Connection, from where it can then be opened in Business Insight Advanced)

Example

In the following example, we are looking to create a sectioned report, showing % of total for each column in the report. Starting in Analysis Studio, we have a crosstab like this:
pct_Base_1_edited
Since Analysis Studio does not report ‘Section’ functionality (as is available in Query Studio, Report Studio and BIA), this will have to be added later.

The first step in Analysis Studio will be to add the desired measure as a nested level within the crosstab view (this will simplify creation of the % calculations later):
pct_Base_2_edited
Next, the ‘% of total’ calculation will be added:
pct_Base_3_edited
Next, an additional dimension will be added, which will form the rows of each section in the final report:
pct_Base_4_edited
This view can now opened directly into Report Studio, or saved to Cognos Connection:
pct_Base_5_edited
From Report Studio, the report can now be saved back to Cognos Connection (under a new name), which will finally enable it to be opened in Business Insight Advanced:
pct_Base_8
(Note: it is hoped that Cognos will improve the inter-Studio workflow in future versions, to enable Analysis Studio view to be opened directly into Business Insight Advanced, either from within Analysis Studio or from Cognos Connection)

This view can now opened directly into Report Studio, or saved to Cognos Connection:
pct_Base_10b_edited
Note the automatic creation of subtotals for rows and columns:
pct_Base_11_edited
In the context of report sections, this is entirely unnecessary. However, currently within BIA there is no easy way to add/remove nested subtotals. After manually cutting out each of the superfluous totals, and sectioning the report (using the Section/Unsection button), we end up with the required report layout:
pct_Base_12b_edited
Summary
It had been hoped that Cognos 10 would introduce some level of Studio ‘rationalization’ in order to simplify the workflow for Business Analysts in particular. Unfortunately, the introduction of Business Insight Advanced (BIA) and Business Insight has thus far only added 2 new Studios without rendering any of the existing Studios redundant. It is to be hoped that in future versions, it will be less necessary to jump around several Cognos interfaces in order to construct what are relatively simply reports.

Footnote: It turns out this is trivially easy to do in Tableau (around 9 mouse clicks) and, ironically, in PowerPlay Client (5 mouse clicks).

Cognos OLAP: Understanding performance differences

Cognos OLAP: Understanding performance differences

January 31, 2013 | By | Add a Comment

OLAPThis weekend, I was reading a very interesting discussion on LinkedIn, on the topic of OLAP (specifically Cognos OLAP). On this thread, ex-Cognoid Norman Bobo does an excellent job of describing the differences between Cognos PowerCubes and TM1.

In his comments, Norman describes in detail several differences between the two technologies. Here is a summary of his key points:

1) Purposes – PowerCubes are a read-only BI solution – TM1 is read/write
2) Dates – PowerCubes have the concept of date dimensions – TM1 does not
3) Levels – PowerCubes have the concept of dimension levels – TM1 does not
4) Attributes – TM1 has strong support for attributes – PowerCubes do not
5) Cube building – very different (TM1 is an in-memory solution, PowerCubes are not)
6) Data Scalability – PowerCubes do not manage large dimensions very well
7) User Scalability – TM1 is not so easily scaled
8) Cognos BI Integration – as a legacy Cognos technology, PowerCubes are more tightly integrated

(I strongly encourage you read the entire thread here)

From a User Experience perspective, I believe IBM would position their various offerings as specialized OLAP approaches to optimize for specific types of applications:

  • Cubing Services dynamic caching layer for large user communities and large data sets, with planned performance and optimization facilities. Central management and IT administration for these large OLAP applications
  • PowerCubes for large user communities and moderate data sets, with fast, consistent performance. Owned and operated by the business, mobile for broad deployment options
  • TM1 for user communities with larger highly dynamic data sets and read/write requirements. Owned and operated by the business.
  • In truth, each solution does has it’s own unique strengths and weaknesses:

    OLAP Differences
    It is also interesting to consider how each solution approaches roll ups and aggregation. Specifically:

    PowerCube – data structures are pre-aggregated:

  • Build time includes the aggregations so read times are faster
  • Calculations are more expensive at build time; not read time
  • User requests for data is retrieved with fast, consistent performance
  • No roll ups or aggregations need to be computed for user data request


  • TM1 OLAP – sources aggregate on the fly:

  • Data loads establish leaf cell values; on demand aggregations and calcs are cached
  • Large data or many calculations will affect 1st time data request performance
  • Pre-Cache ‘high-level’ views following data load for faster first time query
  • Users can alter views / hierachies or contribute data on the fly and recalculate


  • Cubing Services – optimizes the most common paths or caches as you go:

  • Pre-aggregated data using the Optimization Advisor
  • Fast first time query as optimizer routes data requests along optimized paths
  • Run time cache builds up on query results improving performance as cache builds


  • So, which is best for Read-only BI? Well, of course it depends on the customer requirements. As Norman points out in his article, data volumes and user volumes are key considerations. Some general guidelines are as follows:

    OLAP Differences
    It is certainly important to be aware of the frequency & type of reporting required by the user community, as well as the size and geographic location of the user community (e.g. centralised or decentralised). It also worth noting that Cognos internal testing clearly demonstrated that Powercubes scaled very well with increasing concurrent user volumes, whereas TM1 cubes did not.

    Other points of note:

  • TM1 may require additional hardware to scale
  • TM1 is a good option when complex calculations or roll ups are required
  • TM1 is also the engine of Cognos Metrics Studio and Cognos Express
  • PowerCubes can be built ‘in memory’ by setting up a ‘RAM disk’
  • Leverage Business Viewpoint & Cognos Framework Manager for synergy in shared dimensions (e.g. Transformer Dimension ‘re-use’) and common descriptions of data


  • Key takeaways….

  • No single OLAP style or product can meet all needs without losing either quality, performance or scalability
  • Cognos OLAP portfolio covers the full spectrum of performance management needs
  • Each is optimized for the targeted environment/applications/tasks


  • Footnote:
    Interestingly, many years ago I actually built a neural network model (using Cognos 4Thought) of PowerCube build statistics from Cognos customers around the world, in order to identify the factors which had the biggest impact on Cube build times.

    Transformer Cube Build Factors

    Transformer Cube Build Factors

    The neural network model clearly demonstrated the strong correlation between cube build times and the number of categories in the PowerCube.

    A/NZ Business Intelligence Survey

    August 19, 2011 | By | 2 Comments

    Recently, I attended the announcement of the Longhaus Pulse Research on BI and Analytics for 2011. Longhaus Pulse is the most comprehensive and regionally focused assessment of the Business Intelligence and Analytics market in Australia.

    One area I found interesting was Longhaus Managing Director Peter Carr‘s observations around the evolution of the Business Intelligence market. Having worked in the BI industry for almost 20 years, this is something I can definitely relate to. Peter compared the current exciting trends around “Next Generation BI” to the prevalent trends of the 1980’s, 1990’s and 2000’s. Right now, Peter observed, trends around “Cloud” and Social Media are “putting the power back into the hands of the knowledge workers”. It’s certainly interesting that the “Next Generation BI” trends are all around Data Visualization, End User Self-Service, and Mobility (Mobile access to information). In other words, empowering the business user. (Funny, I thought we already had that in the 90’s…). Unfortunately, the 2000s became about “BI Standardization”, Portals and the like which were all heavily IT-centric. In the process, BI vendors perhaps lost sight of what BI was all about. Enabling users to get access to the Right Information, at the Right Time, to make Better Decisions. Longhaus talk about the “Digital Divide”, with BI technology outpacing end-user capability/need (just how many ‘Studios’ do I actually need to get access to my information???)

    The consequence? Spreadsheets. And more spreadsheets. Spreadsheets everywhere.
    The problem with this? Disparate data silos. Poor data integrity. Lack of an audit trail. Lost productivity. Inability to make timely, fact-based decisions.

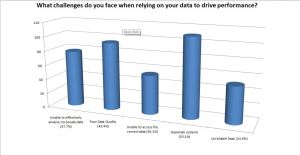
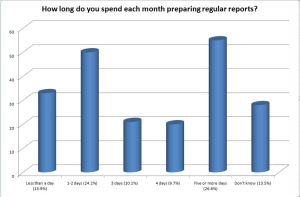
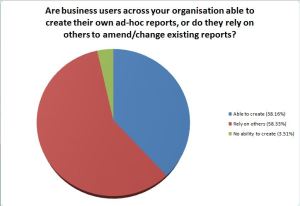
    Which brings me to my recent survey of BI trends in A/NZ. Covering all industries and geographies across A/NZ, I received 230 responses (7% response rate). What became clear from the results was that BI, although assumed to be mature and pervasive, had not solved the Reporting problem in most organisations. For example:

    • Disparate Systems and Poor Data Quality are still views as the biggest challenged faced when relying on data to drive performance.

    • 90% of respondents state that spreadsheets are still being used as part of the query & reporting process

    • More than 1 in 4 spend 5 or more days each month preparing regular reports (ie one week of every month)

    • Over 60% rely on others or have no ability to create their own ad-hoc reports

    Most surprising of all, 40% are currently evaluating (or re-evaluating) their BI vendors, with a further 26% planning to do so within the next 12 months.

    We need to heed the message of frustrated users, and focus on empowering the Knowledge Workers to solve complex business problems. Intuitively. And fast.

    For anyone interested in my full survey results report, I can be contacted via email.

    BI Themes for 2011

    BI Themes for 2011

    June 8, 2011 | By | Add a Comment

    We are starting to see the emergence of so-called “Next Gen” BI. Trends include mobility, visualization/busines discovery, collaboration & search, cloud, “big data”, and a move back to self-service or ‘departmental’ BI. Long gone (thankfully..) are the days of “BI is dead”, “BI is just Reporting” etc.

    According to @Claudia_Imhoff, Business discovery has 4 key points:

    – simple & fast
    – focused & personal
    – shared & social
    – mobile

    Cindi Howsen is also making a list for 2011, and it’s called “5 Big Themes in BI for 2011”

    Cindi predicts “Business intelligence will become more visual, mobile and social in 2011. But how should you balance central vs. departmental control, and does it make sense to upgrade?”

    Here are the 5 Themes:

    1. Advanced Visualization and Dashboards Go Mainstream
    Advanced visualization and discovery tools continue to garner significant interest because of their ease of use, visual appeal, and ability to speed the time to insight amid vast amounts of data.

    2. Mobile BI Gets Recharged
    Mobile BI didn’t even make my top trends last year, so one could say its appearance this year is quite a leap. In the cool BI class I teach at TDWI events, this innovation rarely gets top nod from attendees. However, few could have foreseen the wild adoption of Apple’s iPad. The wider screen real estate and sheer beauty that this tablet brings to BI is reason to take stock of your mobile BI strategy.

    3. Facebook Gives BI More Than a Facelift
    Envision a Facebook influence on BI: decision-makers bring together the right people virtually; users themselves control the flow and content instead of a central IT group who secures the data and subsequent analyses. Tasks, comments, opinions, and even new sets of data and analyses are brought together seamlessly.

    4. Economic Recovery Stretches BI Teams
    The economy shows signs of recovering. Companies that weren’t using BI to work smarter are no longer with us. BI budgets are once again expanding. The challenge is to continue to spend wisely, but also, to keep up with insatiable user demand. Central BI can’t handle it all.

    5. Will New Releases Bring Upgrade Fever or Flu?
    The top-four BI vendors (IBM, Microsoft, Oracle and SAP) all had major new product releases in 2010. Customers who have been burned with painful migrations in the past will not rush to adopt the latest versions. In some cases, 2011 will be a time to assess the cost of upgrading versus the cost of switching preferred vendors.

    (Full article: http://www.informationweek.com/news/software/bi/229000780)

    I’m happy to see the move back towards ‘Self-Service’ BI. When traditional BI vendors walked away from their sweet-spot of quick-win, departmental BI solutions in pursuit of the ‘holy-grail’ of Enterprise Standardization (many users = big $$$…), they lost sight of some of the original attractions of BI in the 90’s: Ease of Use and Time to Value. Hence I was interested to hear how the California Independent System Operator (CAISO) developed a flexible BI environment to help meet the energy needs of 30 million Californians:

    Self-Service BI: An Inside Perspective

    2011 looks like being an exciting year for BI. And not just for vendors.

    Accurate business intelligence is the key to greater efficiencies

    Accurate business intelligence is the key to greater efficiencies

    June 2, 2010 | By | Add a Comment

    For most mid-sized businesses, improving efficiency while reducing costs is regarded as the number one priority. Of course it’s no secret that information management is critical to improved business performance. But with digital information growing at a staggering rate – I think it’s something like eight times the volume housed in all U.S. libraries, every day – businesses need smarter ways to cope with this increasing information overload. And more importantly they need to turn this data into real business intelligence. This can be achieved when companies hire the right kind of people to look after the objectives. And that can happen only when there is no injustice in the recruitment process. According to https://www.salesforce.com/blog/2017/07/20-quotes-about-equality.html, making the employees of a company cognizant of this issue proved to have had beneficial results.

    Far too many mid-sized companies are too reliant on spreadsheets, paper-based documents, emails and the like across silos or disparate business units. Indeed, I’ve been privileged to have some fascinating and frank discussions with CIOs and senior level managers who told me about their over-reliance on inadequate planning tools like spreadsheets. Many indicated that they simply don’t have confidence in their information. Others also revealed that they had missed vital information that should have been used to develop their strategies.

    But while these companies recognise the limitations of spreadsheet-based solutions for Business Intelligence and Performance Management, they simply haven’t had the budget, skills or headspace to implement anything better. In fact, most analysts estimate that only around 35% of midsized companies have implemented a BI and Performance Management solution.

    Midsized companies need a pre-configured solution that includes not just the essential BI capabilities such as reporting and analytics but also planning, budgeting and forecasting. Think of it as giving employees accurate information on which to make critical decisions. As a case in point, since the middle of this year, the New Zealand franchisee of Wendy’s the US-based restaurant chain has been using the tool to keep daily tabs on which burgers are selling best from which of its fifteen stores – bridging the information gap that used to exist between stores and the company’s Te Atatu headquarters.

    For anyone who wants to see my full presentation on this, you can view it on IBM Business Insight SlideShare.