
Category: Big Data

BI Governance in the world of Self-service Data Preparation and Data Discovery
Self-service BI platforms provide significant benefits, however, they have also contributed to a new trend: the “wild wild west” of proliferating BI silos, inconsistent business definitions, no data lineage, no single version of the truth. “Spreadsheet hell” has been replaced with “Self-Service BI hell”.
As Boris Evelson (Forrester Research) recently commented to me via email: “We increasingly hear from our clients that BI silos are now proliferating. Basically these platforms are now becoming the new spreadsheets”.
And that introduces risk. In a recent article in The Economist (“Excel errors and science papers”) it was reported:
“…they had accidentally omitted five rows of their spreadsheet when calculating an average. When included, the missing figures weakened the paper’s conclusion substantially.”
OMG.
Self-service is all about speed and agility, allowing business users to follow their own intuition, answer their own questions, rather than having to rely on IT. In the 1990’s, we used to call it the “next question dilemma”: It’s impossible to predict the next question a business user is going to ask, until they’ve seen the answer to their previous question. Collaborative, self-service data discovery needs to be iterative, exploratory. As people’s reliance on modern technologies has grown, various payroll software businesses have developed their own systems but what are the consideration when it comes to payroll softwares?
But can the “need for speed” in business decision-making be reconciled with the need for Governance? According to Howard Dresner, Governance of BI content creation and sharing correlates strongly to success with BI, improving information consistency and accelerating group-based decision making.
In this context, “BI Governance” includes things like BI lineage, impact analysis, facilitating collaboration and content reuse, reducing content duplication. In  the BI industry in general, we’ve seen what Wayne Eckerson recently referred to as a “pendulum swing” – away from (over) governed BI to un-governed BI. The pendulum is now swinging back, because business users are now starting to ask questions like:
- How do I trust the decision being made?
- How trustworthy is the data? How timely is the data?
- How do I communicate the decision, the thought process behind the decision, the facts supporting the decision?
An added complexity results from the increasing number of additional sources of information available to a business user. I was recently talking to a customer in the Financial Services industry, who was explaining that they receive data such as AML (Anti-Money Laundering) data from external sources, usually in a flat-file format. The users need to merge/blend these data sources with internal data, in order to produce their dashboards and reports, in support of their business decision-making. Due to the time-sensitivity of the data, the users needed more of a self-service approach to the data preparation, but still have some governance in order to retain confidence in the information being communicated.
In another example, a business user at a Government customer used to complain that the BI content they received had no “context”: what am I looking at? What does this number mean? How was it defined? When was it updated? What is it filtered on? It continues to surprise me, after 25 years working in the BI industry, that most BI output still doesn’t contain this kind of basic contextual information.
Hence, perhaps, the number of business meetings which are still dominated by debates about the numbers, who’s “version” of the numbers are correct, instead of actually making productive, collaborating business decisions.
 I’m reminded of something I noticed on a Deep Purple record “Made in Japan”, recorded back in 1971. Ian Gillan, the vocalist, can be overheard asking the sound engineer: “Yeah everything up here please. A bit more monitor if you’ve got it.” To which Ritchie Blackmore, the guitarist, adds: “Can I have everything louder than everything else?”
Without effective, governed self-service data preparation and data discovery, the information becomes noise, trust in the information is diminished, and effective collaboration becomes much more difficult. Everything is louder than everything else.
“It takes two to speak the truth – one to speak, and another to hear.” – Henry David Thoreau

The Need for Speed
At a Big Data conference recently, IBM presented the following slide:

Interestingly, IBM also predicted that 1/3 of consumer data will be stored in the Cloud by 2016, and that 80% of new apps will be distributed or deployed via the Cloud. (IBM also once famously predicted that there would be a world market for 5 computers, which will perhaps one day be viewed as equally laughable as the Australian Prime Minister’s recent assertion that 25mbps Internet speeds are “more than enough”…)
The implications of Cloud Computing + Big Data are: exponentially more Internet traffic and therefore a need for faster, better, more reliable Internet services. A “Big Data Explosion” is certainly underway, and the implications for technology infrastructure are clear, as I attempted to illustrate with this graphic.

As discussed previously (in The Law (and Danger) of Averages), the problem with statistics, such as averages and medians, is that they are often misunderstood, and can be misleading. For example, if I have my left foot in the freezer (0 degrees) and my right hand in the fire (1000 degrees), and my body temperature is 40 degrees, then what temperature am I? Am I ok? My average temperature could be calculated as (0 + 40 + 1000)/3 = 347 degrees. My median would be (0, 40, 1000) i.e. 40 degrees. In this case the average indicates that we have a problem, the median does not.
So, in the case of so-called ‘median internet speeds’, what does this mean? Well, it depends on the methodology used to calculate the median. How was the measurement taken? When was the measurement taken? If it was taken at 5pm on a weekday, that would be different to if it was taken at 3am on a weekend, for example. Without such information, the measurements are pretty much useless for drawing any meaningful conclusions.
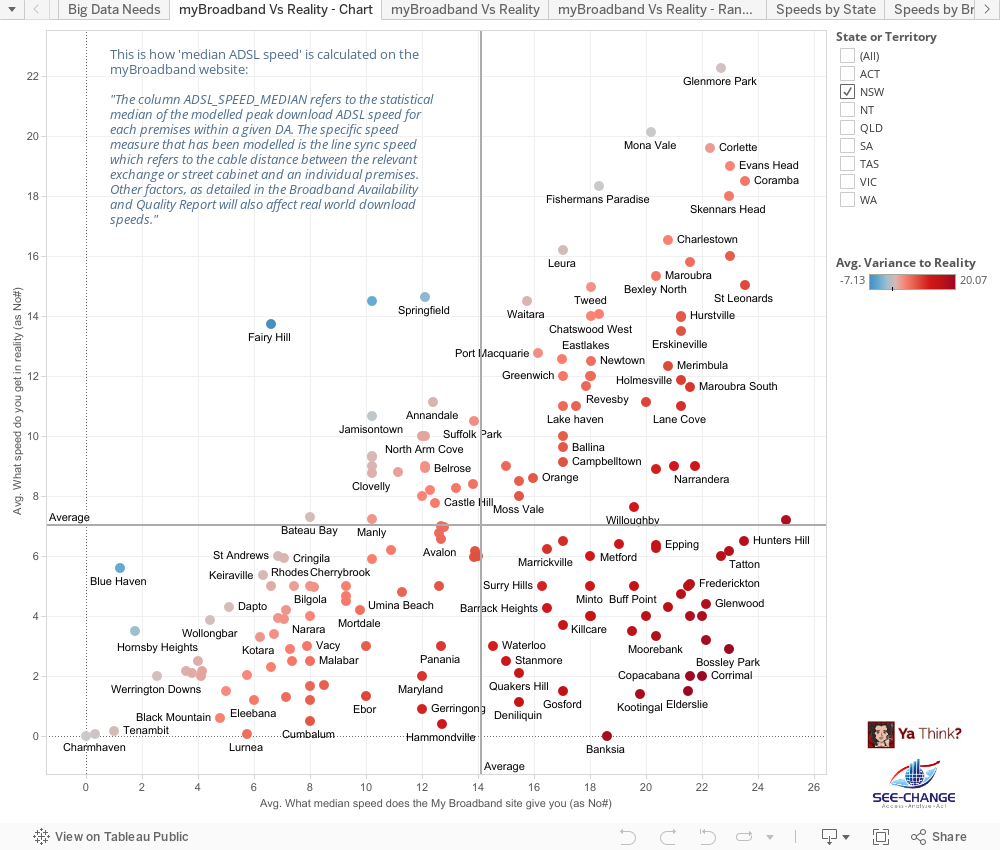
This is how ‘median ADSL speed’ is actually calculated on the much maligned “myBroadband” website:
“The column ADSL_SPEED_MEDIAN refers to the statistical median of the modelled peak download ADSL speed for each premises within a given DA. The specific speed measure that has been modelled is the line sync speed which refers to the cable distance between the relevant exchange or street cabinet and an individual premises. Other factors, as detailed in the Broadband Availability and Quality Report will also affect real world download speeds.”
So the fact that the actual signal gets slowed down by muddy, flooded pits and deteriorating, degraded copper is not reflected in these numbers. The fact that the signal is actually leaving the exchange via a ‘remote integrated multiplexor’ (sub-exchange), which slows the data down from 22mbps (ADSL2+) to 1.5-8mbps (ADSL1) is not reflected in these numbers. Talk about mis-representation of the data. It would appear that Australia’s entire broadband ‘strategy’ is being run along the lines suggested recently by Dogbert:

Dogbert on Dashboards
I was therefore very pleased to have stumbled across this crowdsourced survey of actual ADSL measurements, which formed the basis of a submission to the Senate Select Committee Hearing into the NBN (National Broadband Network – sometimes disparagingly referred to as the NBNNNNN i.e. “National Broadband Network – Not National Non-Network”). The team behind this excellent submission were more than willing to provide the raw data, which I turned into the following set of data visualisations:
When it comes to the Internet, everyone’s an ‘expert’ and everyone certainly has an opinion. However not all opinions turn out to be correct:

Hence the need for technologies such as Business Intelligence and Data Discovery tools, which aim to support “informed, fact-based decision making”. While that will not stop people from turning a blind-eye to the truth, particularly when it’s an “inconvenient” truth they would maybe rather deny, at least it gets the truth out there. (Hurrah for crowd-sourcing, social media and “Open Data”…)

Editorial: Economic Growth in this new ‘Digital Century’
I was recently asked to write an Editorial piece for the bi-monthly ‘Agenda’ magazine published by Gosford Business Chamber. The article is reproduced below, with a link to ‘Agenda’ magazine.
Link to Gosford Business Chamber ‘Agenda’ magazine – online edition
ECONOMIC GROWTH IN THIS NEW ‘DIGITAL CENTURY’
DATA WILL BE A KEY DRIVER OF GLOBAL ECONOMIC GROWTH IN THIS NEW ‘DIGITAL CENTURY’. THIS DIGITAL ECONOMY WILL HAVE A PROFOUND EFFECT ON ALL ASPECTS OF SOCIETY – BUSINESS, EDUCATION, HEALTH CARE, FINANCE AND GOVERNMENT
| Every day, 2.5 quintillion bytes of data is created – in fact, 90% of the data in the world today has been created in the last two years alone.This data comes from everywhere: social media sites, online purchase transactions, mobile phone GPS signals, and so on. This data is known as ‘Big Data’. Visit https://www.couchbase.com/products/mobile to learn more about this.
For small businesses and consumers, this ‘big data revolution’ promises a wide range of benefits. Big data will improve our communities, help us make better decisions and create a wide range of new business opportunities. It is estimated that global online traffic will quadruple by 2015 as the number of gadgets linked to the internet climbs to 15 billion, according to a forecast by Cisco. Over the next decade, analysts expect the global volume of digital data to increase more than 40-fold. From a Central Coast perspective, the opportunity now exists to establish some quick wins from the NBN Rollout, driving economic prosperity for the region. In the US for example, communities are already leveraging these new fibre-optic capabilities to drive innovation and grow their economies. There is no reason that Gosford cannot do likewise, and become the Central Coast’s own ‘Gigabit City’. |
The digital economy removes the ‘tyranny of distance’, helping to level the playing field – particularly for small businesses in regions such as the Central Coast.
|

Connect
Connect with us on the following social media platforms.